


When Things STACK UP
Tolerance stack is a common issue for job shops…but is it always a matter of the worst case scenario?
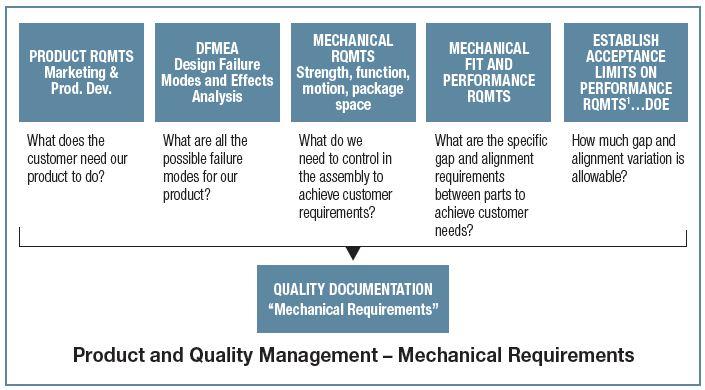
Product manufacturers utilize an organized flow of information to translate customer requirements into product requirements. This process for mechanical requirements is generalized in the flow diagram above. (Fig.1)
Tolerance Stack-Ups are vital to address mechanical fit and mechanical performance requirements. Mechanical fit is simply answering the question, “Do the parts that make up the assembly always go together?” Mechanical performance requirements would include the performance of mechanisms, like switches, latches, actuators, and the like. Other performance requirements could include optical alignments or motor efficiency. So what is a “stack-up”?
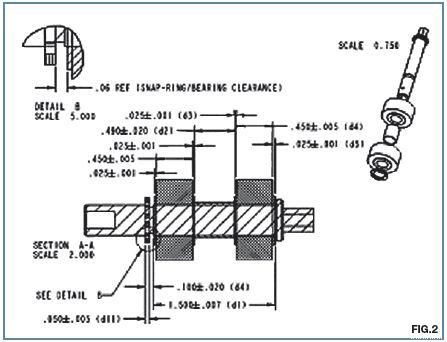
Tolerance stack-up calculations represent the cumulative effect of part tolerance with respect to an assembly requirement. The idea of tolerances “stacking up” would refer to adding tolerances to find total part tolerance, then comparing that to the available gap or performance limits in order to see if the design will work properly. This simple comparison is also referred to as worst case analysis. Worst case analysis is appropriate for certain requirements where failure would represent catastrophe for a company. It is also useful and appropriate for problems that involve a low number of parts. Low being defined as three or four parts. Worst case analysis is most often done in a single direction, i.e. a 1D analysis. (Fig.2) If the analysis involves part dimensions that are not parallel to the assembly measurement being studied, the stack-up approach must be modified since 2D variation such as angles, or any variation that is not parallel with the 1D direction, does not affect the assembly measurement with a 1-to-1 ratio.
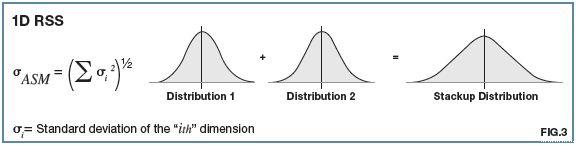
Many companies utilize a statistical method for tolerance analysis. One approach involves a simple calculation using the RSS Method, Root-Sum-Squared. (Fig.3) Instead of summing tolerances, as in worst-case analysis, statistical analysis sums dimension distributions. It is important to understand that the inputs values for a worst-case analysis are design tolerances, but the inputs for a statistical analysis are process distribution moments (e.g., standard deviation). Worst-case analysis (also called tolerance stack-up analysis) can be used to validate a design. Statistical analysis (also called variation analysis) can be used to predict the actual variation of an assembly based on the variation of the part dimensions. Comparing the assembly standard deviation to the assembly limits allow for the calculation of quality metrics like sigma, % yield, DPMU, etc. This approach requires distributions to be normal with all parts at the same quality level, i.e. +/- 3σ.
Given the limitations of RSS, other methods for calculating assembly variation have been developed. One such method (incorporated into Sigmetrix CETOL 6 Sigma software, for example) is called the Method of System Moments. This method eliminates the limitations stated above. Analyses of all complexities, i.e. 1D, 2D, and 3D, 79can be created with no restriction on distribution type or quality level. Companies can now do full Assembly Variation Analysis with tolerance analysis software.
Assembly variation analysis provides insight required to identify the key part characteristics, (KPCs) that must be controlled in order to produce a product that meets the expectation of the customer. The product development process should then become focused on defining and validating part manufacturing and assembly processes that are capable of achieving high producibility levels. Goals of Cpk = 1.67 for key features and Cp = 1.33 for non-key features are commonly quoted. Utilizing the insight for variation analysis allows design engineers to allocate tolerance budgets strategically. Critical features will be held to tighter tolerances. Looser tolerance can be applied to less important features. These decisions not only ensure product quality and performance, but also ensure manufacturability at the right price. The impact on the product development process can be huge.
Tolerance stack is often a unidirectional problem, but it can create higher order issues in complex parts. In that case, statistical tolerance analysis can be is used to understand how these tolerances contribute the various performance characteristics of the design. A statistical tolerance analysis is when you take the variation of a set of inputs to calculate the expected variation of an output of interest. In mechanical engineering, a product design is composed of multiple features, each with tolerance values that control the variable aspects of those features.
1D TOLERANCE STACKUP
The simplest form of tolerance analysis is the single direction, 1D Tolerance Stackup. A 1D Tolerance Stackup is created by creating a cross section of a model and adding the tolerance values for each feature in a straight line. The variation in each contributes to the overall output/outcome.
WORST-CASE ANALYSIS VS RSS (ROOT-SUM SQUARED) STATISTICAL ANALYSIS
In a Worst-Case Analysis, each dimension will have a minimum and maximum value that represents the range of acceptability for that dimension. Worst-Case answers the question, if I take the maximum range on each input, what is the maximum range for the measurement of interest or stackup? We are therefore dealing with the limits of acceptability and not probability.
RSS (Root-Sum Squared) Statistical Analysis does not focus on the extreme values, but focuses on the distribution of the variation for each dimension. Each dimension will have a unique distribution of values based on the manufacturing process. Tool wear, operator differences, changes in material and environment all contribute to variation in the dimension value. Each dimension has its own distribution curve.
When you combine the probabilities for each dimension (each separate curve) you get the probability for the total and therefore the distribution curve of the total. Statistical analysis answers the question, given the distribution of variation on each dimension what is the probability that my performance characteristic will fall within defined acceptable limits. The limitation of RSS is that it assumes all inputs are normally distributed and all performance characteristics have a linear relationship with the dimension. These assumptions do comnot account for the breadth of conditions that exist in typical scenarios found in manufacturing.
SECOND ORDER TOLERANCE ANALYSIS
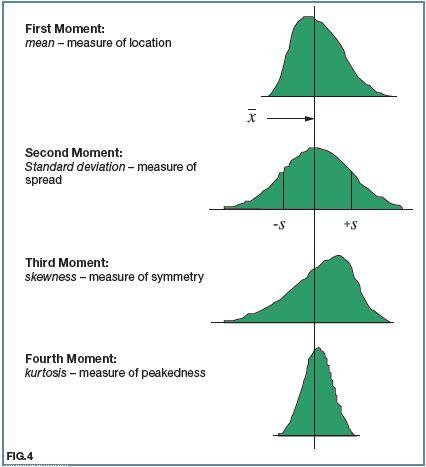
Because manufacturing methods vary for different types of parts, the distribution moments or parameters change as well. RSS only uses standard deviation and does not include the higher moments of skewness and kurtosis that better characterize the effects tool wear, form aging and other typical manufacturing scenarios. Second Order Tolerance Analysis incorporates all distribution moments (Fig.4)
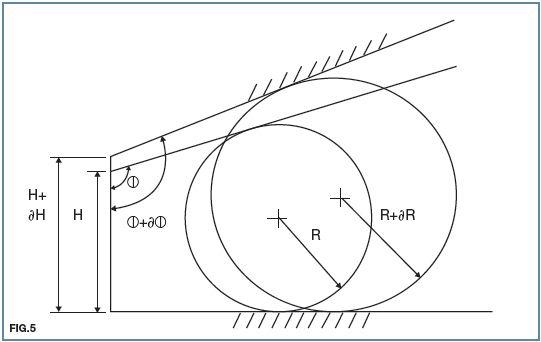
Second Order Tolerance Analysis is also needed to determine what your output is going to be when the assembly function is not linear. (Fig.5) In typical mechanical engineering scenarios kinematic adjustments and other assembly behaviors result in non-linear assembly functions. Second order calculations are much more complex so hand calculations are not advisable but the computation accuracy is greatly improved and becomes viable within a tolerance analysis software package.
SUMMARY
The choice in tolerance analysis method is based on many factors, but the can be summarized as “Which method best matches the manufacturing and inspection process of the assembly”. For simple fit problems, a 1D stack-up may be sufficient. RSS is sufficient for the small number of scenarios where the inputs are normal and the assembly relationships are linear. For all other scenarios, Second Order Tolerance Analysis is required to address the real world of manufacturing. CM
Courtesy, Sigmetrix LLC. www.sigmetrix.com
About the Author
About the Publication

subscribe now
Keep up to date with the latest news, events, and technology for all things metal from our pair of monthly magazines written specifically for Canadian manufacturers!
Start Your Free Subscription- Stay connected from anywhere

Easily access valuable industry resources now with full access to the digital edition of Canadian Metalworking.
Easily access valuable industry resources now with full access to the digital edition of Canadian Fabricating & Welding.
- Trending Articles
1
Automating additive manufacturing

2
Sustainability Analyzer Tool helps users measure and reduce carbon footprint

3
CTMA launches another round of Career-Ready program

4
Sandvik Coromant hosts workforce development event empowering young women in manufacturing

5
GF Machining Solutions names managing director and head of market region North and Central Americas